How to Align BPM with Organizational Goals for Maximum Impact
How to Align BPM with Organizational Goals for Max
Century Software helps professional services organizations unify their data, automate their workflows, and put trusted AI to work, so every team operates from one governed Center of Truth.
Book a Consultation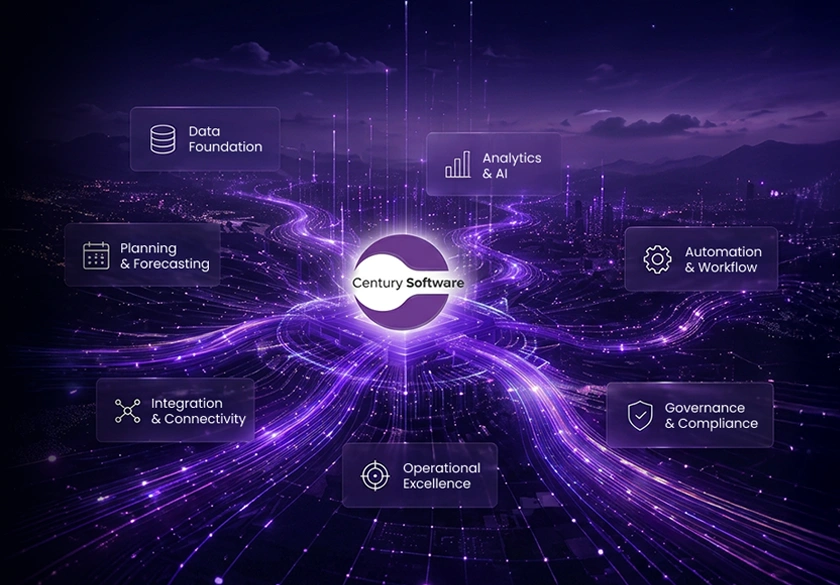
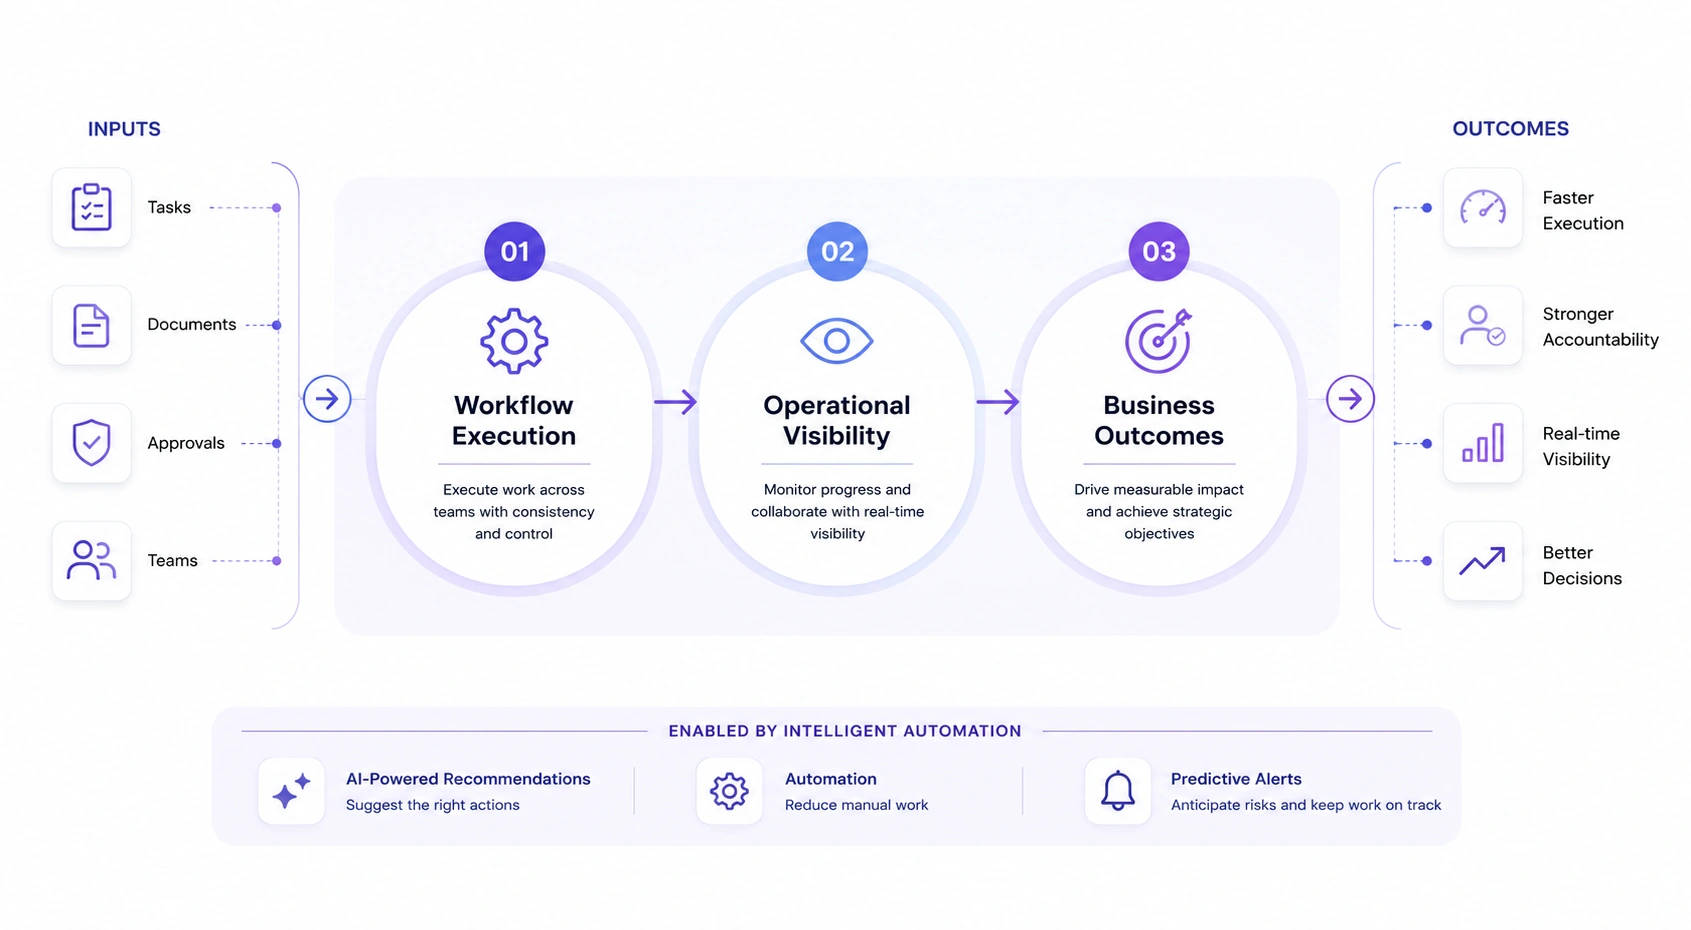
Century Software enhances your existing workflows with intelligent automation and unified collaboration to reduce manual work, improve accountability, and give leadership real-time visibility into execution.
When data lives across different vendors, clouds, and platforms, you don't own your data. Century Software helps you consolidate your operational data into a centralized environment your organization controls. From that foundation, AI surfaces insights, flags anomalies, and supports decision-making in real time to give you one governed, auditable, secure data foundation. Your Center of Truth.


Professional services organizations are inherently distributed — but not because everyone is always remote or embedded on site. Partners, managers, and staff split time between offices, travel, client meetings, and flexible work schedules. Teams span time zones, workloads fluctuate around deadlines, and decisions often need to move forward without relying on synchronous meetings or a single point of presence.
Our platform, powered by Jugl, is designed with this reality in mind. Built on a mobile-first architecture, it enables tasks, approvals, client updates, and team conversations to progress in real time whether users are on iOS, Android, or desktop.
In this environment, AI agents connected directly to your firm's data act as always-available teammates. They surface the right information at the right moment, assist with reviews and approvals, and route work to the appropriate stakeholders — helping teams stay aligned and productive even when people aren't working at the same time or from the same place.
How to Align BPM with Organizational Goals for Max

Optimizing Business Process Management: Key Strate

Learn how Business Intelligence helps CPA firms im
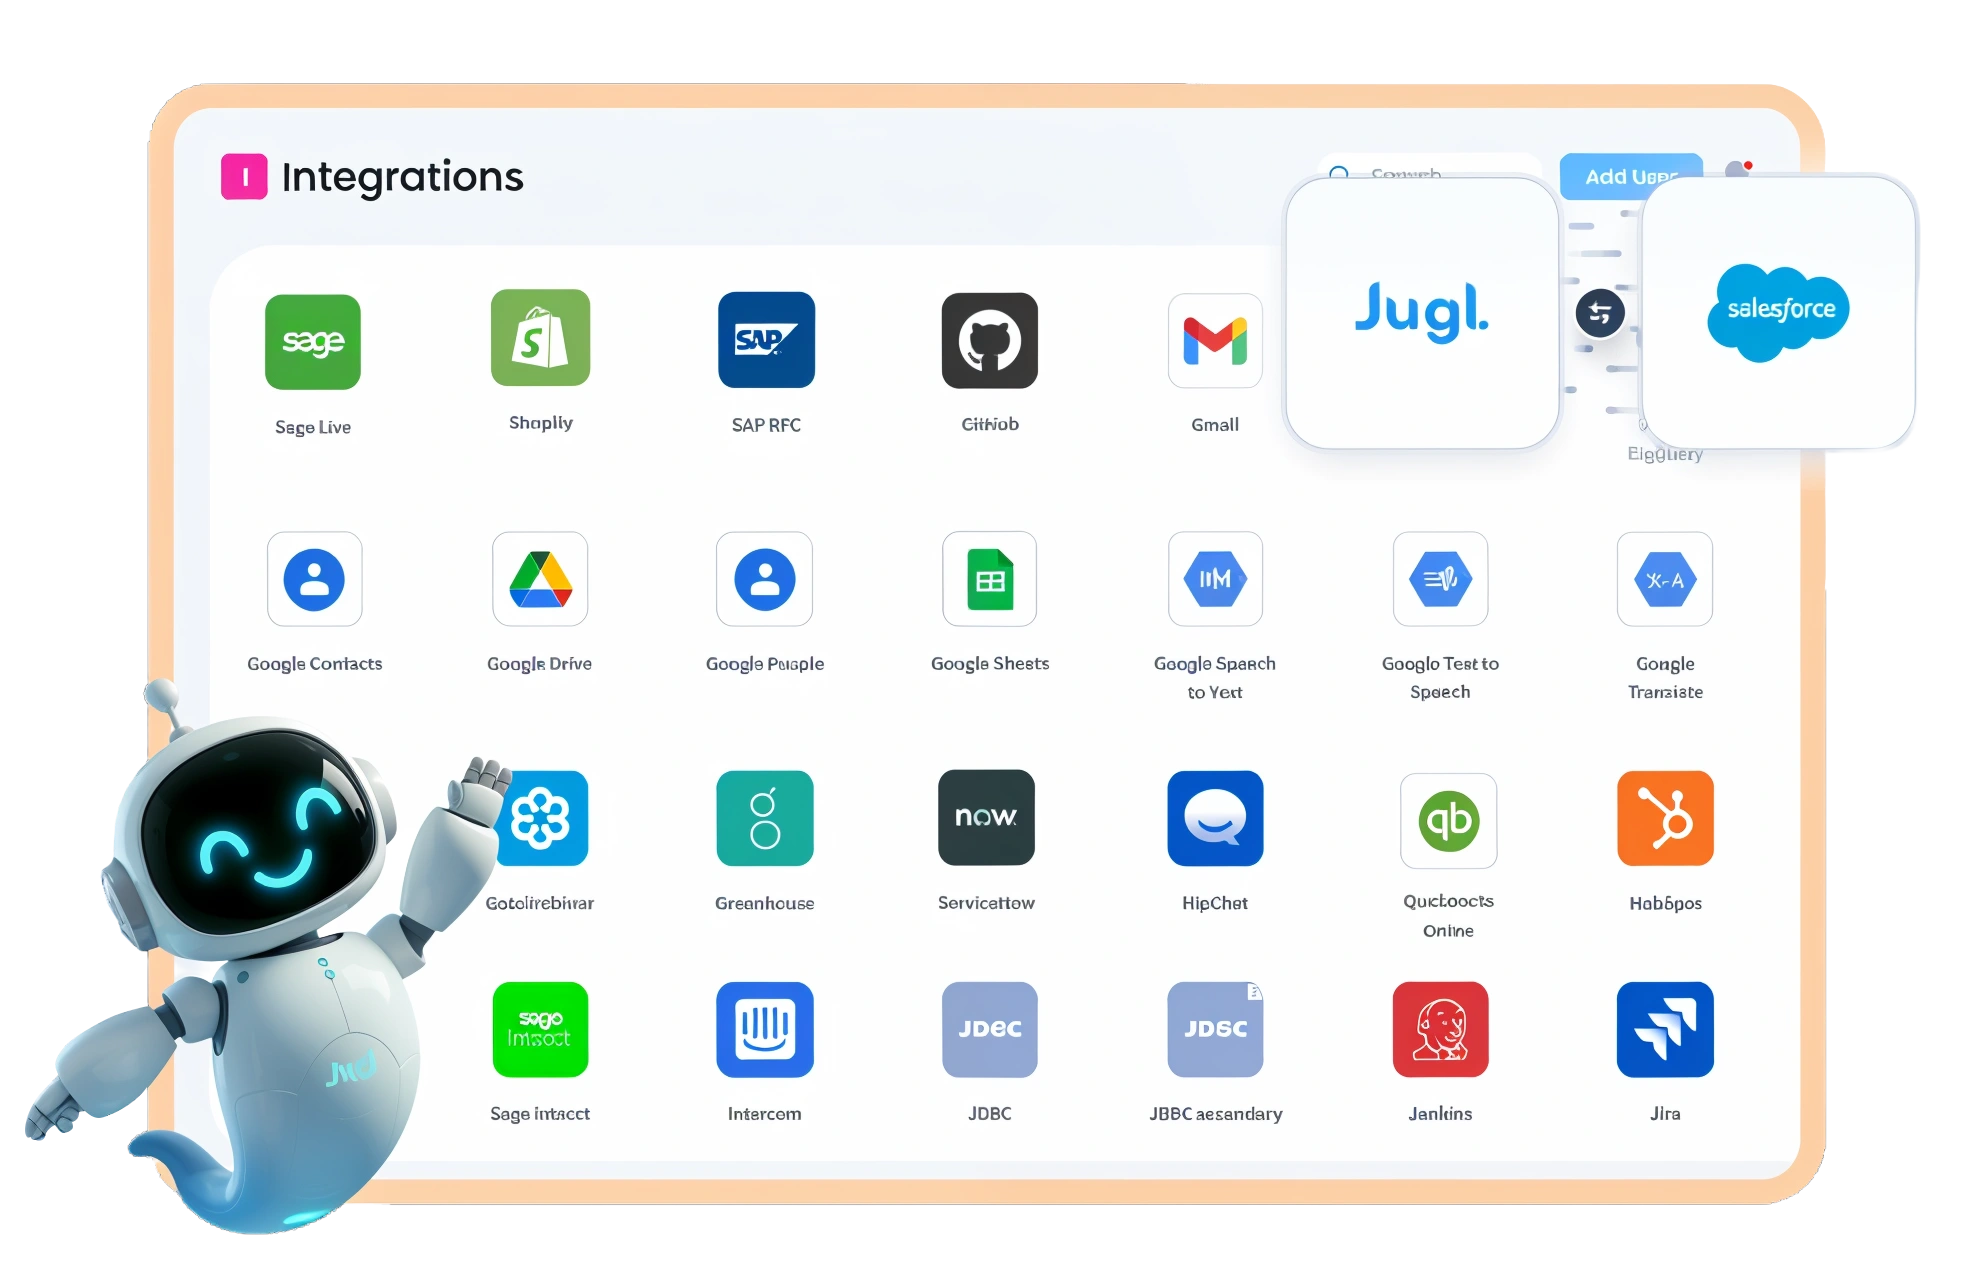
Century combines operational expertise with flexible technology that adapts to the way organizations already work — connecting systems, standardizing processes, and improving visibility across the business. With a governed Center of Truth, a flexible platform built for iOS, Android, and desktop, and reliable AI assistants, teams move faster with clear accountability without ripping and replacing the tools they already rely on.
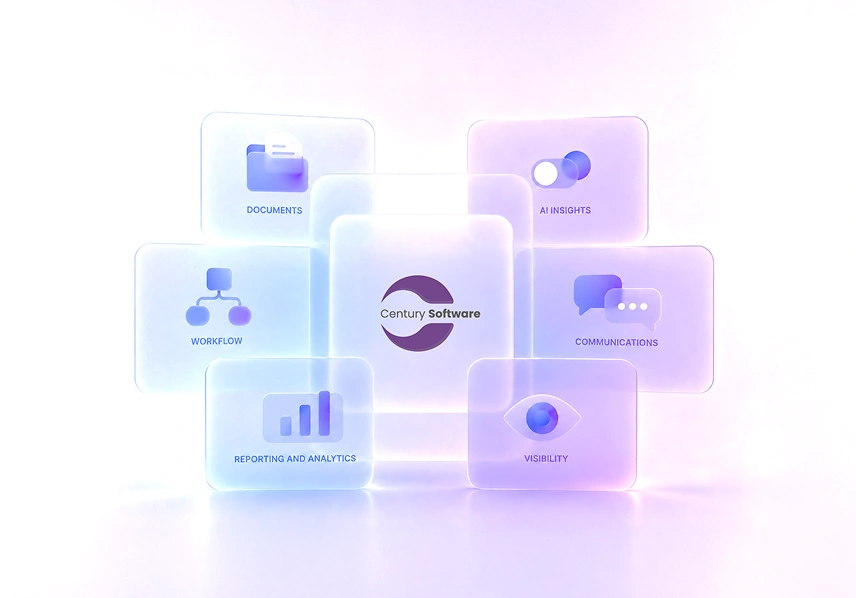
About UsOur platform capabilities span across the core areas your organization depends on.


See what's possible when your data, your teams, and your workflows finally work as one.
Book a Consultation